Understand performance. Diagnose what's actually driving results.
Sales-performance intelligence for SDR teams. Every day is scored against your real sales environment, every funnel stage is read against an expected range, and every rep's month is projected while there is still time to change it.
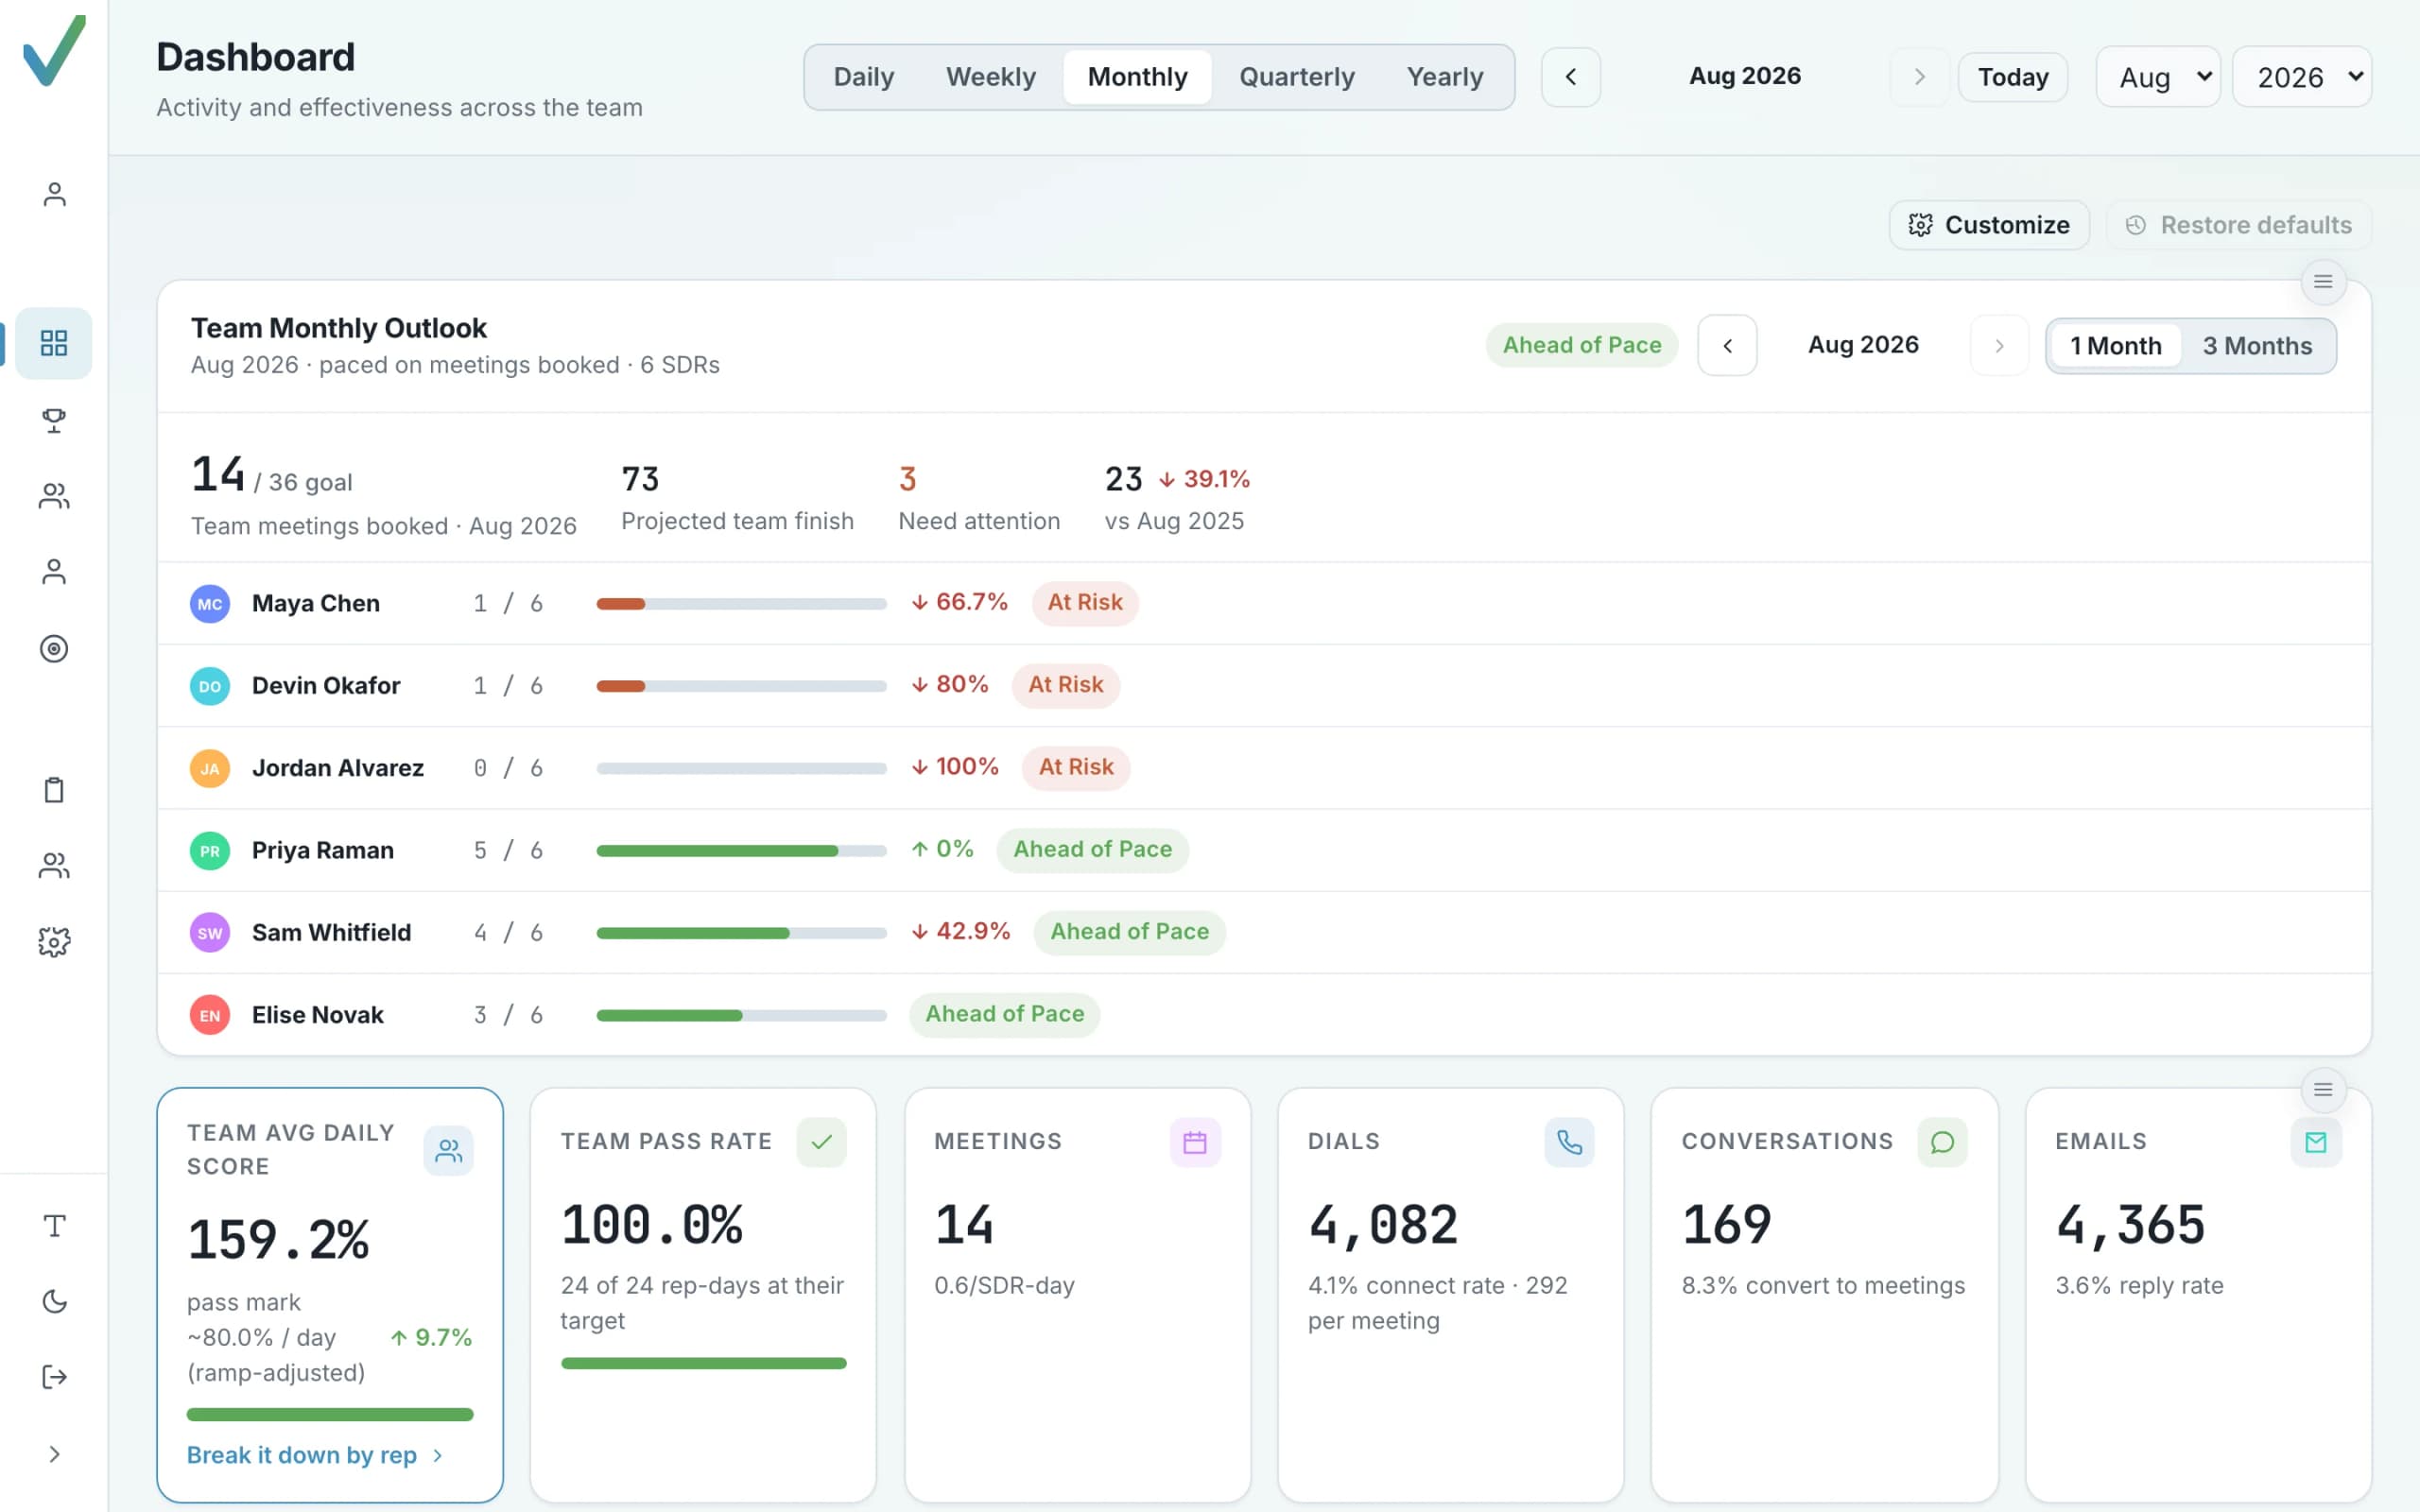
4 of 21 working days in · at this rate, trending toward about 26 by period end.
Every stage is read against an expected range — with a tolerance, so nobody is called underperforming over 2%.
Expectations come from your sales environment and, once there is enough history, from your own numbers. A stage reads At expectation inside the range or within 10% under its low end, Above when it clears the range, Below when it misses by more than the tolerance. The earliest stage reading Below is the bottleneck.
Scored against your environment, not a universal target.
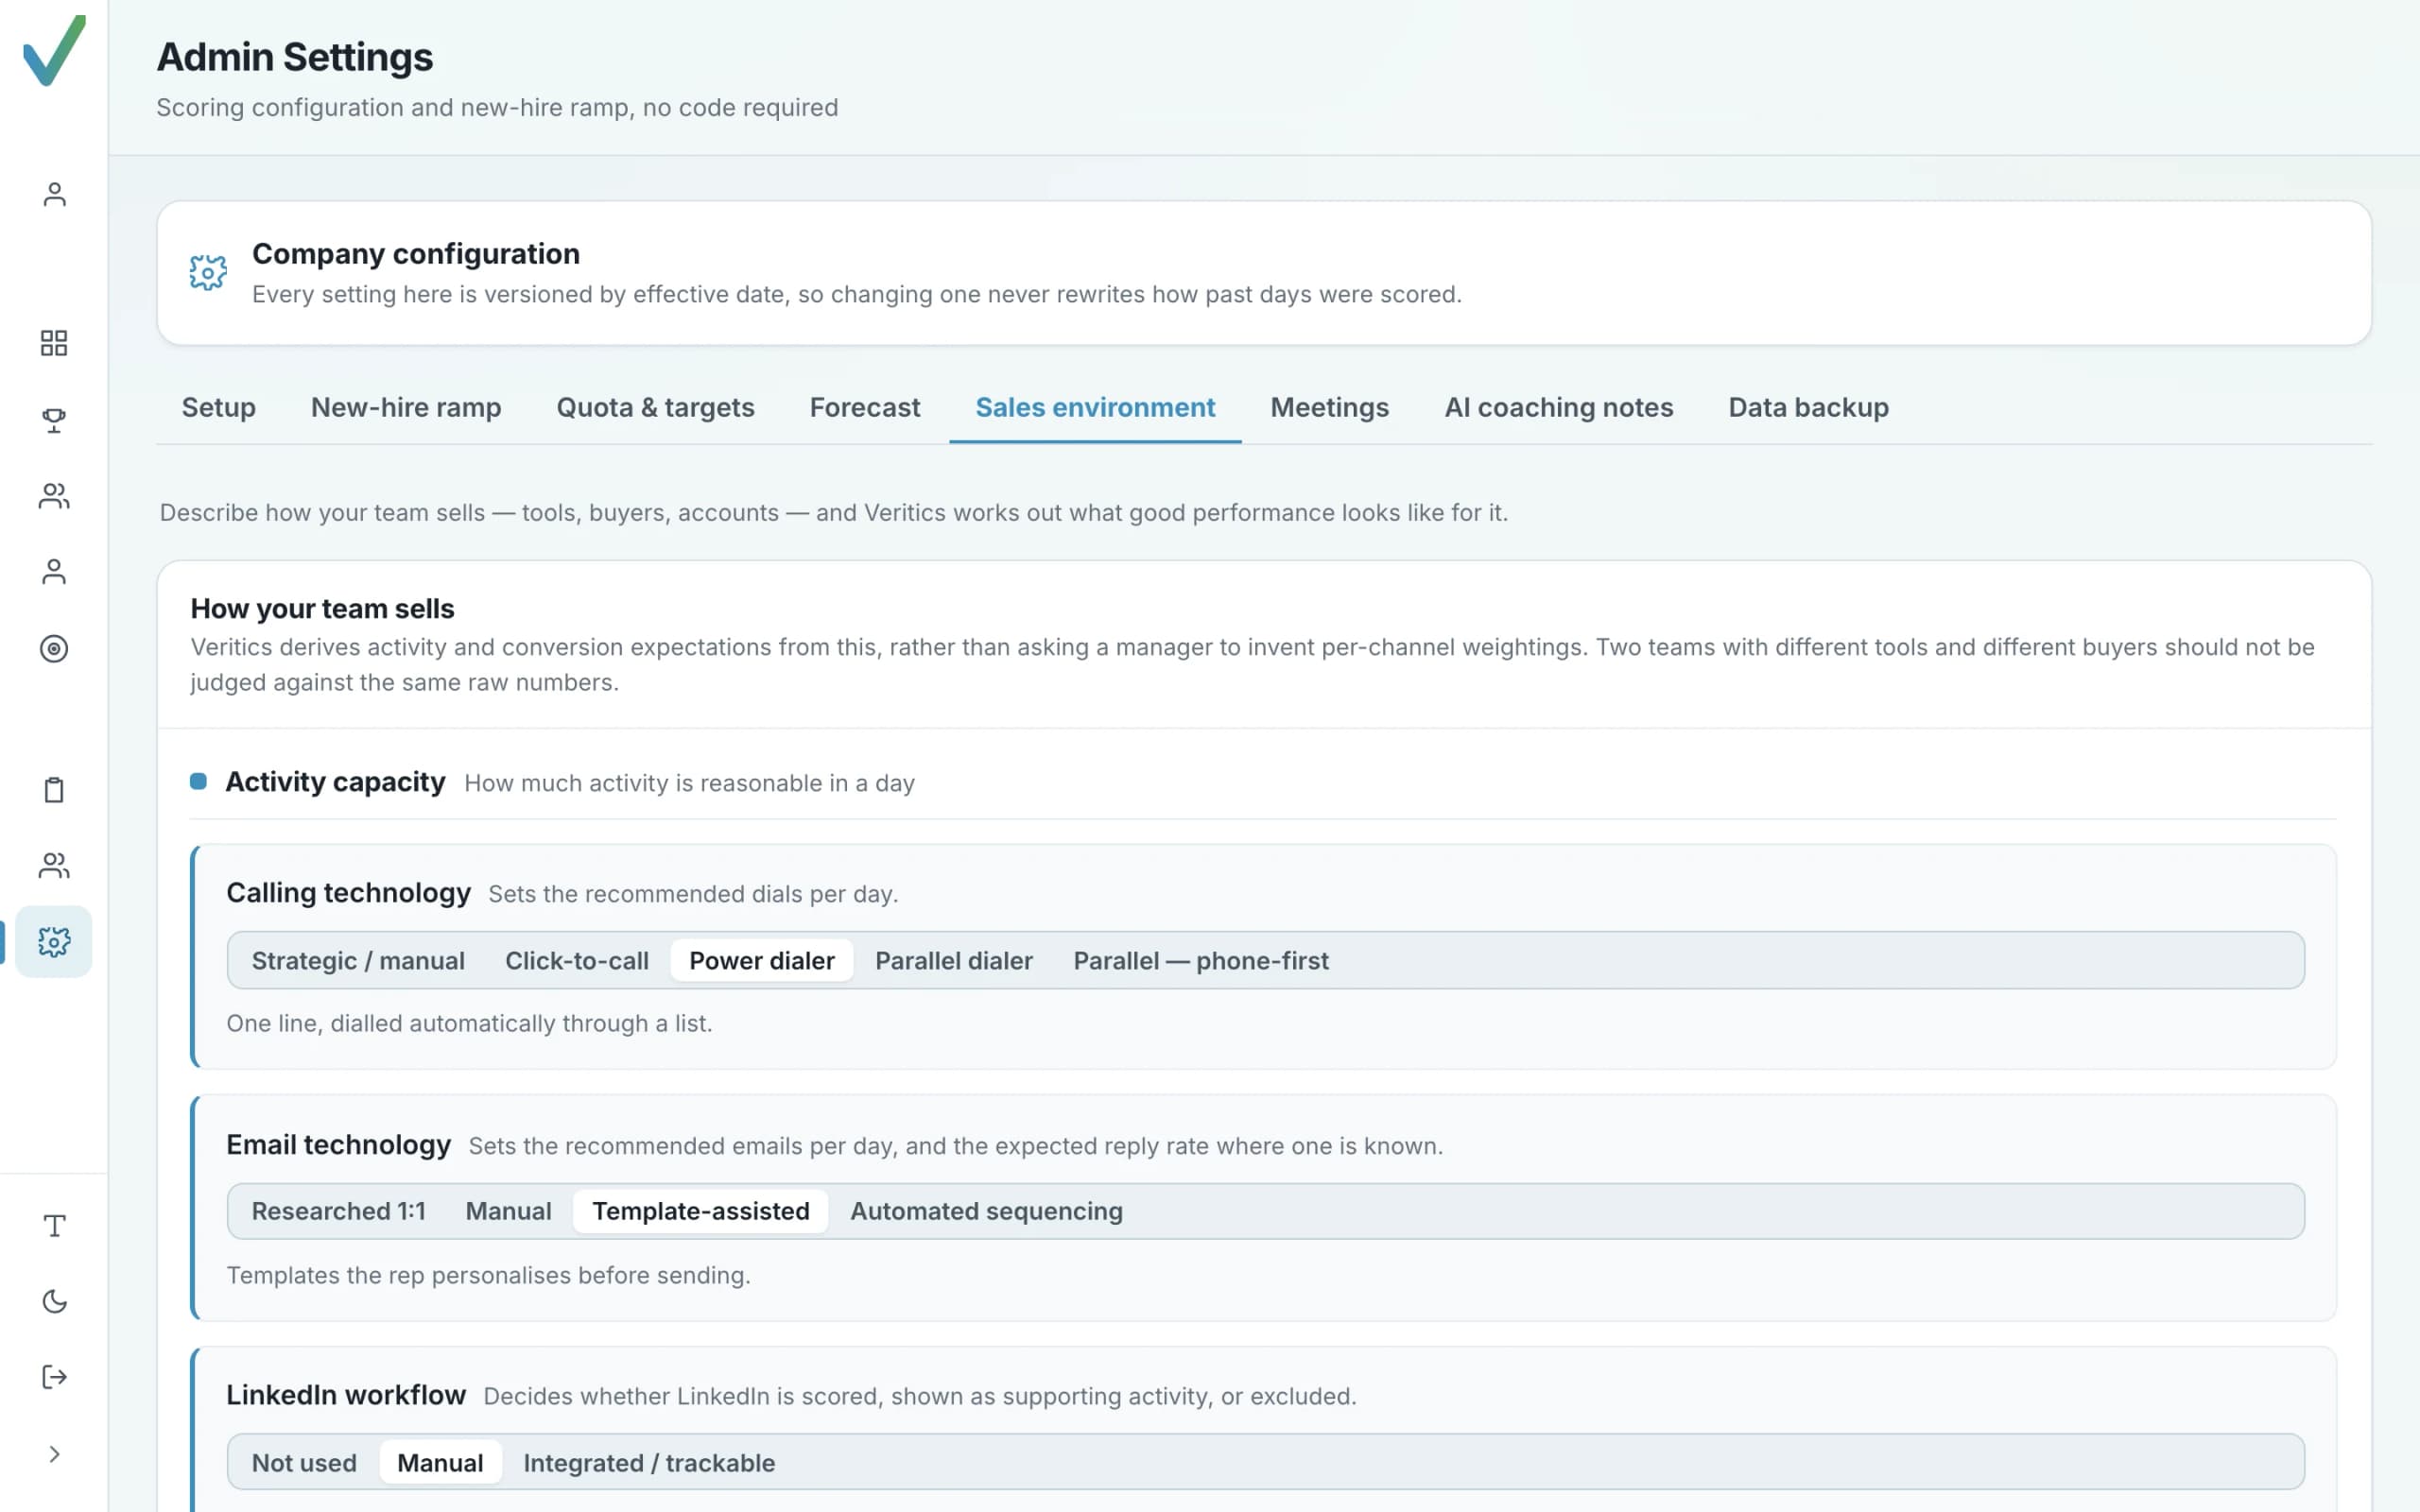
Describe how the team sells — tools, buyers, data quality — and Orvik derives activity and conversion expectations from it. Two teams with different tools and different buyers should never be measured against the same raw numbers.
- Calling and email technology set what a reasonable day looks like — a parallel dialer and a researched 1:1 motion are not judged on the same dials.
- Conversations count more than the dials that produced them; a meeting is the strongest single thing a day can contain.
- Eligible working days are the denominator: ramp, approved PTO and after-quota days are handled explicitly, never as zeros.
Every configuration is versioned by effective date, so retuning a benchmark tomorrow never rewrites how yesterday was scored.
Where the constraint actually is.
Dials → connects → conversations → meetings, each stage measured against an expected range with a tolerance so a rep 2% under is not called underperforming. Select any stage on the card to see why it reads that way. The verdict separates two questions that dashboards collapse: is there enough activity, and is that activity producing what it should?
- Insufficient activity: below the activity bar and below the output bar — activity is the first thing to address.
- Conversion weakness: plenty of activity, weak output — worth investigating, and never answered by asking for more dials.
- Funnel inefficiency: the earliest failing stage is the bottleneck, because downstream stages only see what survived upstream.
- Targeting or motion issues: readings that stay below expectation even at healthy volume point at who is being worked, not how hard.
6 of 6 benchmarks come from your own history rather than external data. The external reference is kept alongside each one for comparison.
Select a stage to see why it reads that way.
Know where the month lands before it ends.
The Monthly Outlook shows meetings booked against goal for the team and for each rep, with a projected finish and a status that means something. Attainment pacing you can act on in week two, not a post-mortem in week five.
- Paced on working days, anchored to quota on day one and to the rep's actual run rate from day two.
- A tenured rep is projected from their own history automatically; a manager can pin anyone to the company baseline.
- Goal Hit, Ahead of Pace, On Track, At Risk, Missed Goal — or Too Early to Project, when it honestly is.
At this rate, trending toward about 26 by period end. Pacing is on working days, from the rep's own run rate.
- Maya Chen1 / 6-66.7%At Risk
- Devin Okafor1 / 6-80%At Risk
- Jordan Alvarez0 / 6-100%At Risk
- Priya Raman5 / 6+0%Ahead of Pace
- Sam Whitfield4 / 6-42.9%Ahead of Pace
- Elise Novak3 / 6Ahead of Pace
Who needs attention, and why.
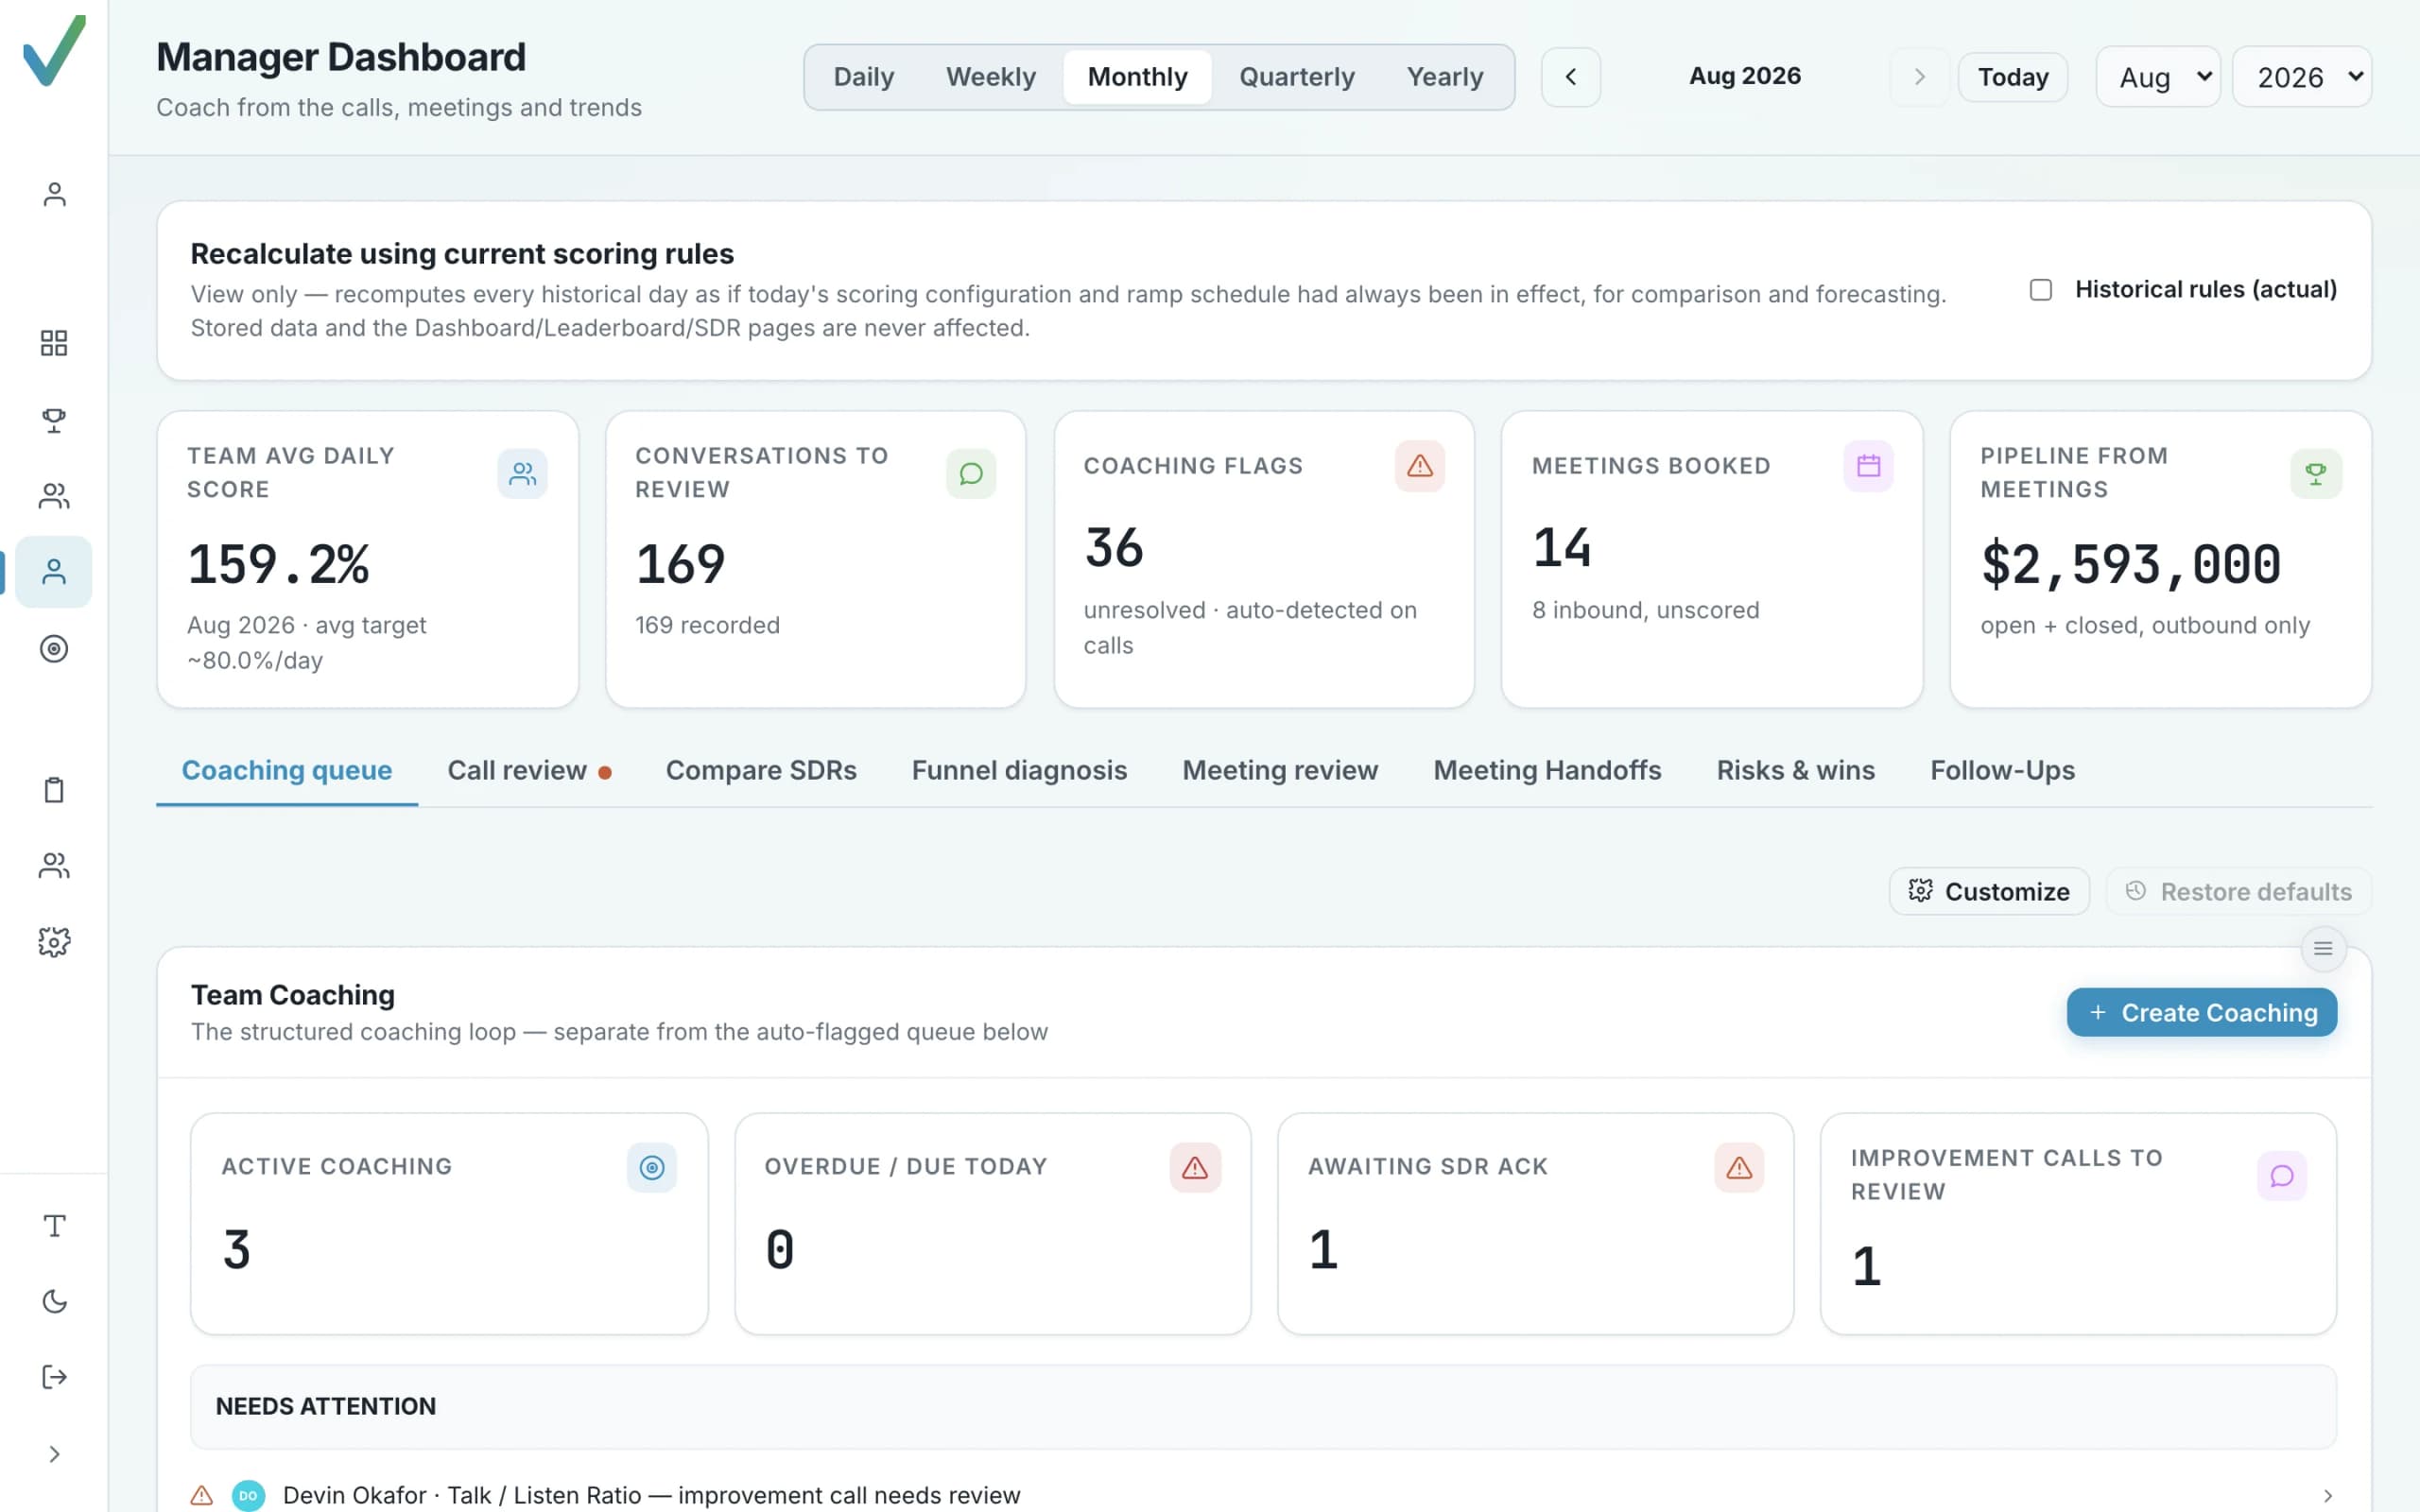
The Manager dashboard is built for the 1:1: a coaching queue, call and meeting review, connect rate, common objections and a head-to-head comparison — so the conversation starts from the specific thing to change.
- Team dashboard: score trend, pass rate, meetings, dials, conversations and emails with the story behind each number.
- Leaderboard and rep detail: ranked by score for the period, with every rep's daily breakdown one click away.
- Coaching loop: manager feedback, rep follow-through and proof of improvement in one developmental cycle.
- Follow-ups and meetings: who to contact and when, and which meetings were handed to which AE.
Inbound and outbound stay separate. Closed Won stays attributed.
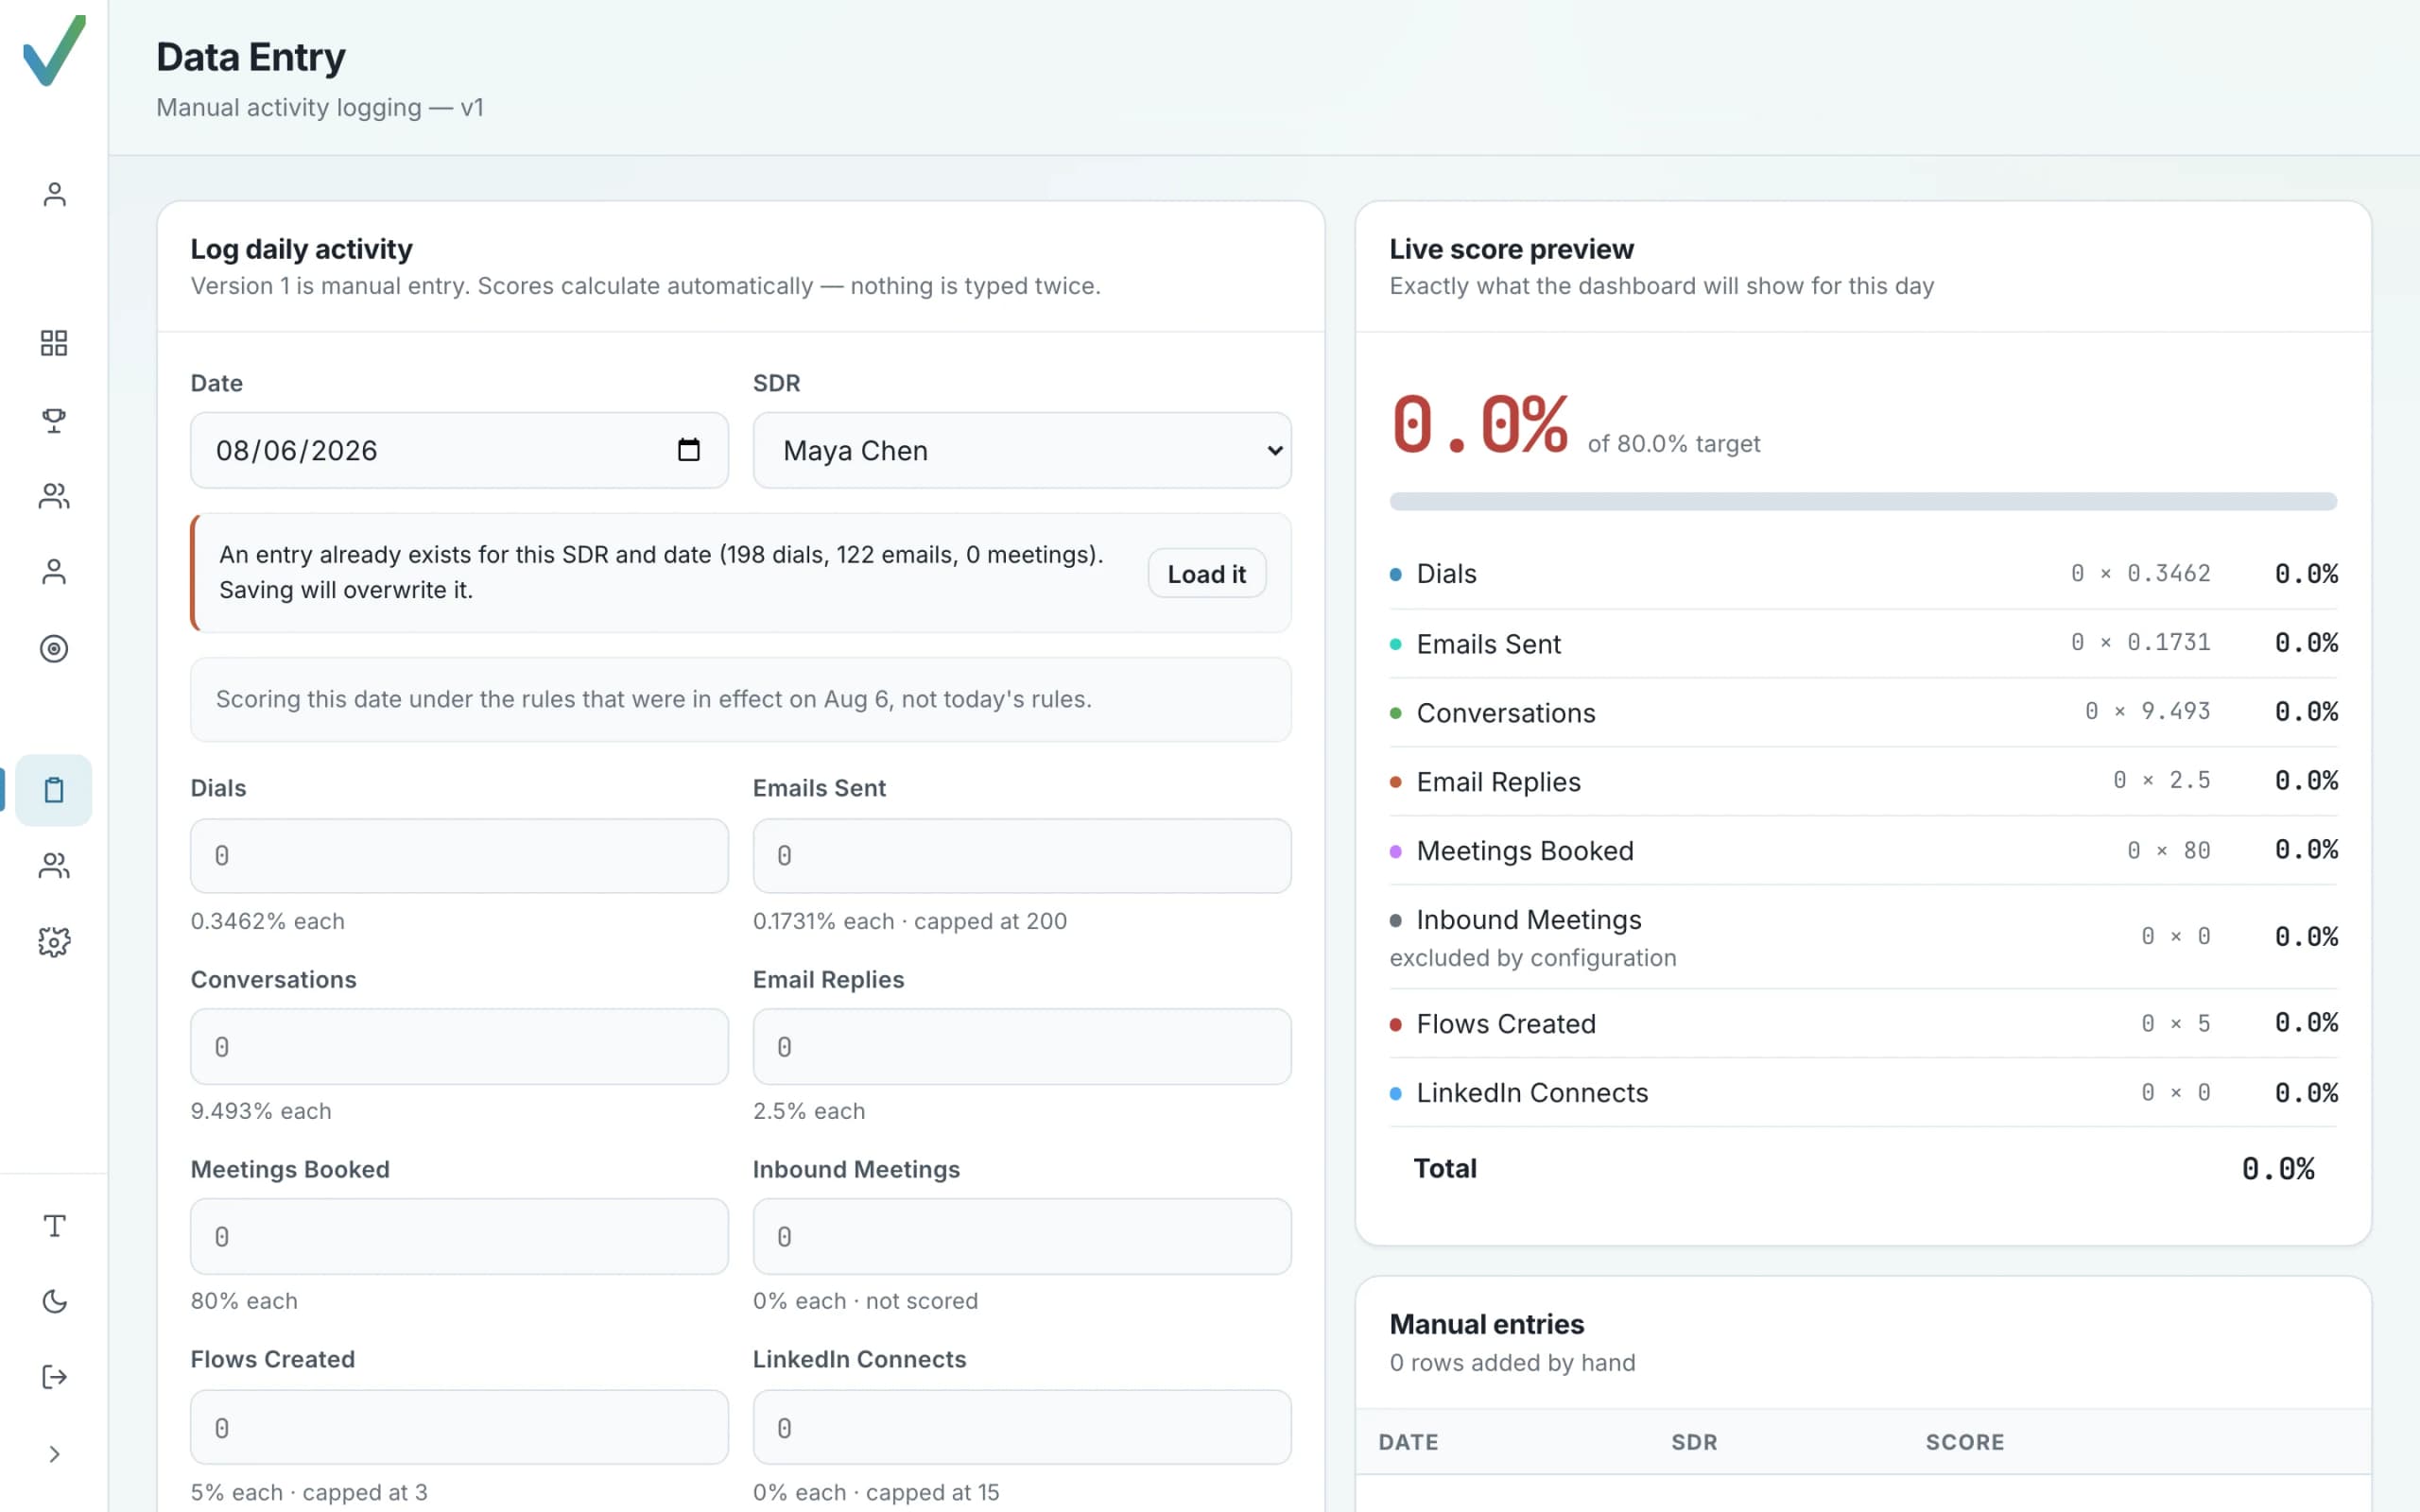
A meeting can be real and valuable without counting toward quota. Orvik keeps both facts, and shows a rep's sourced outcomes without turning the product into a pipeline tool it isn't.
- Daily entries record inbound and outbound meetings as distinct fields, so an inbound month never masquerades as outbound performance.
- Which meetings count toward quota is a company decision, configured in Orvik — not an assumption baked into the score.
- Closed Won credits the rep who booked the meeting the deal came from: SDR-sourced revenue attribution, not AE pipeline management.
The Closed Won card runs on placeholder sample data today; it is designed to be fed by a CRM connection when one is live.
Straight answers about Analytics.
$49 / user / month. 14-day free trial with the full product — nothing artificially crippled.
Is this just another activity dashboard?
No. Dashboards show counts. Analytics scores every day against what your environment should reasonably produce, diagnoses which funnel stage is constrained, and projects where the month lands. The number you see is a verdict with a reason, not a total.
How does data get into Analytics today?
Activity is logged in Orvik — a rep or manager records each day's dials, connects, conversations, emails, replies and meetings. Workspace data is held in the browser's local storage today, with full backup export and restore built in (the server-side store is being cut over progressively). Third-party connectors are not live yet; see the Integrations page for exactly what is and isn't connected.
Does Analytics punish reps who are new, on PTO, or already at quota?
No. New hires are scored on an effective-dated ramp schedule, approved absences are removed from the Activity Health denominator entirely (they are never counted as a zero), and a rep who has already hit quota earns a reduced-activity bonus rather than a penalty.
Is Closed Won a pipeline tool?
No. Closed Won is SDR-sourced revenue attribution: a deal is credited to the rep who booked the meeting it came from. Analytics does not manage AE pipeline. Today the Closed Won card runs on placeholder data until a CRM connection exists.
Is there AI in Analytics?
There is one optional, clearly labelled feature: AI coaching notes, which draft a short 1:1 note from a reviewed call using an Anthropic API key you supply in Admin Settings. Scoring, diagnosis and projections are deterministic — no model decides a rep's number.
Start with Analytics.
$49 / user / month. Try it free for 14 days, buy it outright, take the guided demo, or talk it through with Orvik.